Monday, August 26, 2024

Those who aim to discover - I

As a follow-up to my previous post, I'd like to share some additional reflections on the experience of doing hydrology in academia. I've attempted to classify different types of researchers, and below, you'll find the first part of this classification.


There are those who discover. This process involves observing data, identifying unexpected aspects of the water cycle and related sciences, and expanding the empirical base as progress is made. In this sense, science is also about keen observation and m uch of scientific work is conducted in this way. To better grasp this, consider the field of natural sciences. Hydrology is also a natural science and phenomena discovery, observation, classification is an important part of it. Today the field is positively contaminating a lot considering hydrology feedbacks with biology and geochemistry, ecosystems behavior. [[This does not mean that what has to be discovered is all in the interdisciplinary studies, many historical hydrological issues not having being solved yet.]]

Examples of discoveries in data present in literature are, for instance: the observation of self similarity (fractality) in many geophysical sciences which revealed a scale-free response of catchments and hydrologic systems which is not fully explained. Shifts in precipitation timing and intensity, increased frequency of droughts, or altered snowmelt patterns that significantly impact water availability and hydrological cycles in ways not previously anticipated. Anomalous runoff coefficients caused by the presence of karst or melting glaciers. Effects of human activities at various scales. Effects of groundwater water distribution and redistribution in the overall cycle and at various spatial scales. Different stress response of plants with respect to droughts. Unexpected old age of water in runoff  challenging the understanding of runoff production. Missing rainfall events, due to lack of space-time resolution of observations.  Fill and spill and other non intuitive and sometimes counterintuive phenomena in runoff. 

If what you see is new, you can easily publish it. But even if it is a confirmation of something new, you still can. I would distinguish "discover" from "measure". Measures, experiments and field observations have their own place and a different literature. 

It is clear that to discover in data the simple and literal observation is not enough. The help of some tools and some mathematics is necessary, even if researcher who excel in narrative capabilities and metaphor production exist and sometimes do without (do not follow their example if you are not a very gifted writer). 

Sunday, August 18, 2024

You want a tenure-track position ? (Sunday Thinking)

You embarked on this postdoc to advance your career and, ideally, secure a tenure-track position somewhere in the near future. But what strategy should you follow?
First and foremost, focus on building a solid publication record. Aim for about three publications per year—fewer if they're with a small number of co-authors, and possibly more if there are many co-authors. Prioritize publishing in reputable journals, preferably in higher citation quantiles, and ensure your work demonstrates a clear research trajectory and distinct academic personality.
It's also important to gradually differentiate yourself from your postdoc advisor. This could involve publishing with other colleagues or clearly highlighting your unique contributions in joint papers with your advisor. Aim to be the first or corresponding author, or the primary driving force behind at least 50% of your papers. However, remember to credit your co-authors appropriately—being selfish won't serve you well.


Managing your relationship with your advisor requires a delicate balance. Both you and your advisor need visibility and recognition, though your needs may differ. Learn to navigate this relationship to ensure mutual satisfaction while avoiding toxic dynamics.
Building a strong professional network is crucial. Be visible in your department and, more importantly, in the wider academic community of your subdiscipline. Engage actively by fostering collaborations, organizing events or sessions at major conferences, and contributing to departmental initiatives. Your advisor can support you in this, but it’s vital to establish connections with influential researchers who can later provide further strong and informed reference letters.
Mentoring students and giving guest lectures will enhance your visibility and demonstrate your ability to fulfill a professor's role. 
Seek funding early on. There are many opportunities, and securing funding not only proves your ability to thrive in the competitive research environment but also signals to potential hiring departments that you can bring in resources and enhance their reputation.
Overall, approach your job search with professionalism. This involves crafting a strong CV, preparing thoroughly for interviews, and respecting the time and resources of the institutions you're applying to—a principle that holds true for both PhD and postdoc candidates.

At the core of all this is doing good science—not just average work, though that is still honorable, but truly innovative and solid research on some topic where you can be reconigned as a  active contributor. This requires dedication, the right tools, intuition, and the capacity to recognize new opportunities while holding firm to your vision (do you have one?). Don’t sacrifice quality and originality for the sake of productivity (up to a point!).
While following trends might offer short-term gains, it won’t serve you in the long run. However, being overly rigid in this belief can also be a mistake, as science constantly evolves, and shifts in language and focus can quickly render even well-founded arguments to look obsolete. So, while trends shouldn't dictate your work, it’s wise to remain aware of them.

Everything works better if you find the right advisor (right is not the better, is the ones that fit with you).

Monday, August 5, 2024

Mumbai GEOframe School !

 We have just completed our effort with the GEOframe Mumbai Monsoon School, inserted in a larger initiative, of the GISE HUB which included one day long SCPP workshop on "Recent Advances in Hydrological Modelling" on 31st July. Besides being trained on GEOframe, hands on training on Dynamic Budyko model was provided by prof. Basudev Biswal (GS) and his postdoc  Prashant Istalkar. Lectures on the 31st July covered a wide range of topics including flood inundation modelling, socio-hydrology, land-surface modeling, climate-change impact assessment, machine learning models, and complex networks.


Great thanks to
Sumit Sen and Basudev Biswal for organizing the School. Hospitality was superb, discussions enriching and seeing the dedication and smartness of students an encouraging academic experience. We hope that the School will have follows up both at IIT and UniTrento and exchanges could continue in the future. For further information, see also the Linkedin post by Basudev here. 
The GEOframe material of the School is available to anyone and the slides and videos (when uploaded) will be available at the GEOframe blog page dedicated to the School.
The success of the School, from our side, is the outcome of many that are listed in this "people of GEOframe" presentation available here. 
For students who want to complete a personal exercise with GEOframe, the GEOframe team is available to assist. Upon completion, each student will receive a University of Trento T-shirt.

Thursday, July 4, 2024

A Ph.D. position on snow modelling and the related runoff production

 APPLY TODAY ! There is an opening until July 10 (<---Here it is the link) for a Ph.D. position on the SpaceItUP and SUPER projects (Snow and glacier rUnoff Production in alpine RivER basins 1990-2050)


Due to climate change, the Alpine region is experiencing a reduction in snow quantity (snow droughts) and an increase in evapotranspiration losses (green water), with significant consequences for sustainable water resource management and ecosystem preservation. This project aims to develop new models to quantify snowmelt and evapotranspiration losses, providing practitioners with calculation tools that are different from traditional lumped parameter models but simpler than 3D process-based models. The project also intends to study the water content obtained from snow and glaciers, from the present to 2050, in the Po and Adige river basins, assessing both quantitative and temporal variations in contributions. The primary tools for the analyses will be the open-source models of the GEOframe system, integrated, modified, and improved by the new models. The modeling will be supported by the acquisition of Earth observation products derived from the MODIS and Sentinel platforms, and potentially other platforms as data becomes available. The final product of the research, concerning snow forecasts, will be developed on a regular grid of 250 meters, while flow rates will be produced for each section of interest. The analyses for the control period from 1990 to 2022 will be conducted on both daily and hourly scales, providing a valuable "reference data cube." Future projections will be produced on a monthly scale. As part of enhancing the current state of the art, which is typical for a doctoral project, reliability criteria and error estimation methods will be developed for each produced dataset. The work will be done in collaboration with dr. John Mohd Wani as co-advisor. Collaborations can include working and exchanging ideas with dr. Christian Massari (GS), Professor Manuela Girotto (GS), Prof. Stefan Gruber (GS), Giacomo Bertoldi (GS), Kelly Gleason (GS), Marco Borga (GS) and Stefano Ferraris (GS).
Old work on snow and permafrost of the group can be found here (to be updated soon).
 The deadline is approachinf very fast, therefore APPLY! To better understand the policies of the group, please give a reading here 

Thursday, June 27, 2024

How much snow is in the mountains and what is its fate? by Manuela Girotto

Water resources such as snow or groundwater can be estimated using satellite remote sensing observations and numerical models. Both models and observations have inherent uncertainties and limitations related to observation errors, model parameterization, and input uncertainties. A promising method to alleviate shortcomings in models and observations is data assimilation because it combines existing and emerging observations with model estimates, thus bridging scale and limitation gaps between observations and models. 


Using these tools, we can address the following science questions: How much water is stored as seasonal snow? How much is in the groundwater aquifers? Can we quantify hydrological changes due to human induced processes (e.g., irrigation)? This presentation will focus on the estimation of snow seasonal amounts in mountainous regions, the water towers of the world. They supply a substantial part of both natural and anthropogenic water demands and they are also highly sensitive and prone to climate change. Slides of the talk can be found by clicking on the above figure. 

 
The presentation was followed by an interesting discussion that you can see here below:

Sunday, June 9, 2024

On catchment analysis (modeling)

In a series of papers (Abera et al., 2016, Abera et al. 2017a, Abera et al., 2017b, Azimi et al., 2023), we have outlined a methodology for studying basins, focusing on specific locations BUT looking especially to the methodologies. They are also summarized in slides that I typically use in my hydrological modeling classes. These slides summarize the analysis requirements in seven key steps, supported by various notebooks that implement the methodologies.


Each time we begin a new catchment analysis, please ensure these methodological suggestions are considered. Overlooking them can be quite frustrating. Consistently revisit and apply the reference material to build upon previous work and past achievements. Criticize previous methods if necessary, but do not disregard them.
There are two critical steps that are often neglected. The first is data analysis—specifically, examining data coherence and comparing multiple data sources. This preliminary analysis can provide significant insights before any modeling begins, but it is rarely pursued. Instead, input data are directly used in the model, leading to issues later because something seems off.
The second neglected step is validation. There is a tendency to be satisfied with performance metrics like KGE or Nash-Sutcliffe, but these should be starting points, not final assessments. Other benchmarks, such as those proposed by Addor et al., (2018) should be used to critically evaluate the results, not just applied mechanically.
Recently, Azimi et al., 2023 introduced a more refined analysis method (called in future papers EcoProb), which allows for finer discrimination of model behavior by separating the ranges of response. This method should be considered for more precise analysis.
Additionally, since Abera (and likely earlier), we have tried to refocus our analysis on not just discharges but also on budgets. Understanding budget behavior can reveal significant insights and prevent errors, but it is often sidelined. We need to improve in this area.
Mapping is another crucial aspect. While we often rely on time series plots, spatial representation is essential to show the irreducible spatial heterogeneity. This is evident in soil moisture studies, such as the recent work by Andreis et al., and should also apply to other quantities like snow cover and depth.
I have worked with many of you to create effective graphs and maps. Using a full range of colors is beneficial, but please remember that some journals (AGU and EGU) require color-blind friendly plots. Address this requirement from the beginning to avoid last-minute modifications.

P.S. I - One distinguishing feature of GEOframe compared to other systems is its ability to explore multiple working hypotheses. Although this capability exists, it has not been utilized so far. Let's make full use of it moving forward.

P.S. II - When I read a paper from collaborators, I assume that all materials, including data, software, notebooks, and .sim files, are organized and shared as supplemental material for reproducibility. To achieve this, it is crucial to maintain order and keep the material up-to-date from the beginning. Otherwise, it becomes a nightmare.

References

Abera, Wuletawu, Luca Brocca, and Riccardo Rigon. 2016. “Comparative Evaluation of Different Satellite Rainfall Estimation Products and Bias Correction in the Upper Blue Nile (UBN) Basin.” Atmospheric Research 178-179 (September): 471–83. https://doi.org/10.1016/j.atmosres.2016.04.017.

Abera, Wuletawu, Giuseppe Formetta, Luca Brocca, and Riccardo Rigon. 2017. “Modeling the Water Budget of the Upper Blue Nile Basin Using the JGrass-NewAge Model System and Satellite Data.” Hydrology and Earth System Sciences 21 (6): 3145–65. https://doi.org/10.5194/hess-21-3145-2017.

Abera, Wuletawu, Giuseppe Formetta, Marco Borga, and Riccardo Rigon. 2017. “Estimating the Water Budget Components and Their Variability in a Pre-Alpine Basin with JGrass-NewAGE.” Advances in Water Resources 104 (June): 37–54. https://doi.org/10.1016/j.advwatres.2017.03.010.

Addor, N., G. Nearing, C. Prieto, A. J. Newman, N. Le Vine, and M. P. Clark. 2018. “A Ranking of Hydrological Signatures Based on Their Predictability in Space.” Water Resources Research 54 (11): 8792–8812. https://doi.org/10.1029/2018wr022606.

Azimi, Shima, Christian Massari, Giuseppe Formetta, Silvia Barbetta, Alberto Tazioli, Davide Fronzi, Sara Modanesi, Angelica Tarpanelli, and Riccardo Rigon. 2023. “On Understanding Mountainous Carbonate Basins of the Mediterranean Using Parsimonious Modeling Solutions.” Hydrology and Earth System Sciences 27 (24): 4485–4503. https://doi.org/10.5194/hess-27-4485-2023.

Monday, June 3, 2024

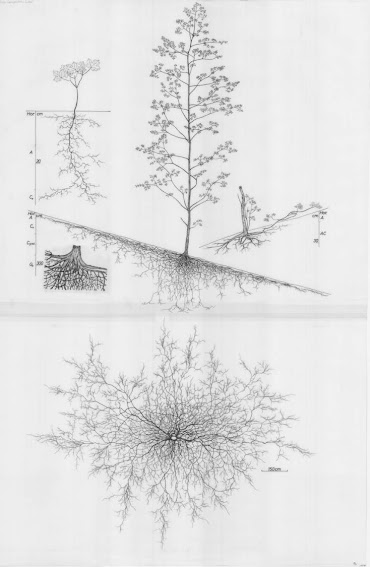
Roots (plants roots)

 How deep go the roots of a plant ? Certainly it depends on the age of a plant but for having a static idea, nothing is better than the collection of roots drawing that can be found at the Wageningen University repository.

Clicking on the figure, you can access it.